For some Stanford fans, the greatest source of consternation about Saturday's Pac-12 Championship against Arizona State is not that the Sun Devils are much improved since September (and they are), but that the game will not be played at Stanford Stadium. The road has not been kind to the Cardinal in 2013, particularly when it comes to the Stanford offense, and especially in the red zone.
Stanford drops from #1 in the nation (sole possession) to #109 in nation in red zone efficiency when moving from home to road. (!!!!)
— David Lombardi (@DavidMLombardi) December 3, 2025
The disparity between red zone production at home and on the road is most evident in the passing game.
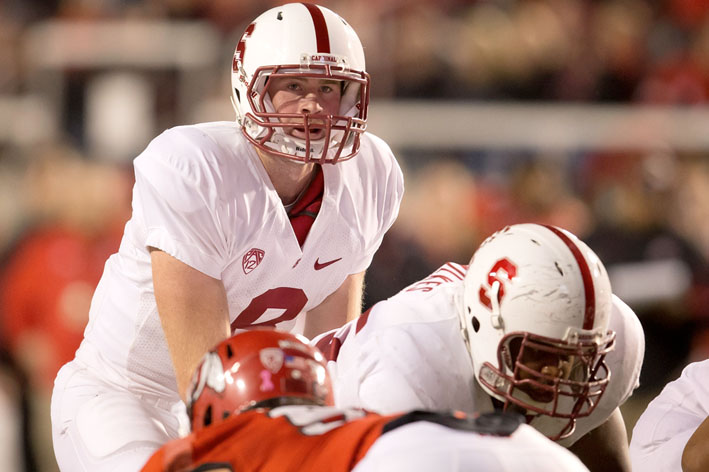
Consider: Kevin Hogan had more completions in the red zone in Stanford's 42-28 win over the Sun Devils on Sept. 21 (4) than he has had in the Cardinal's five road games combined (3). Hogan's road red zone numbers are nightmarish: 3-for-16, one touchdown, two interceptions. At home, he's 12-for-20 with five touchdowns and no interceptions.
Here's a game-by-game look at Stanford's red zone performance on the road. (I won't blame you if you skip the Utah and USC games.)
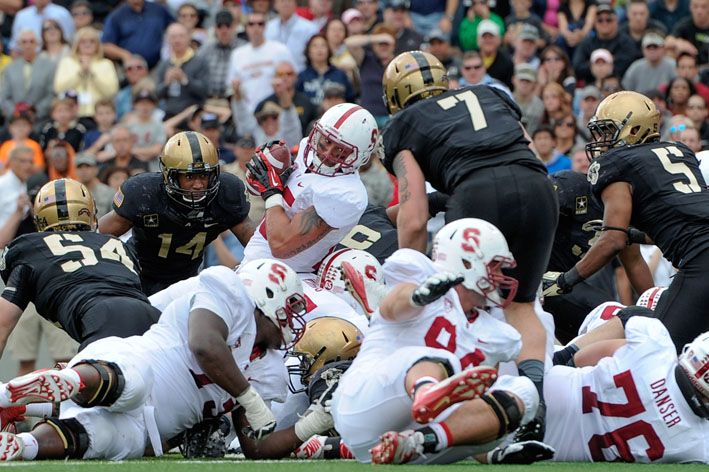
ARMY
Red Zone Trips: 3
Red Zone Scores: 3 (2 TDs, 1 FG)
Play Selection: 5 Runs, 2 Passes
Hogan: 0-for-2
Stanford scored on all three of its red zone trips against the Black Knights. Tyler Gaffney accounted for both touchdowns, the first a 23-yard touchdown reception and the second a 1-yard run. The touchdown catch came after a personal foul penalty bumped the Cardinal out of the red zone, so it isn't reflected in the play selection breakdown or Hogan's red zone passing stats above, but it does count as a red zone score. The Cardinal's red zone field goal came after Devon Cajuste was ruled out of bounds on a 14-yard catch late in the second quarter.
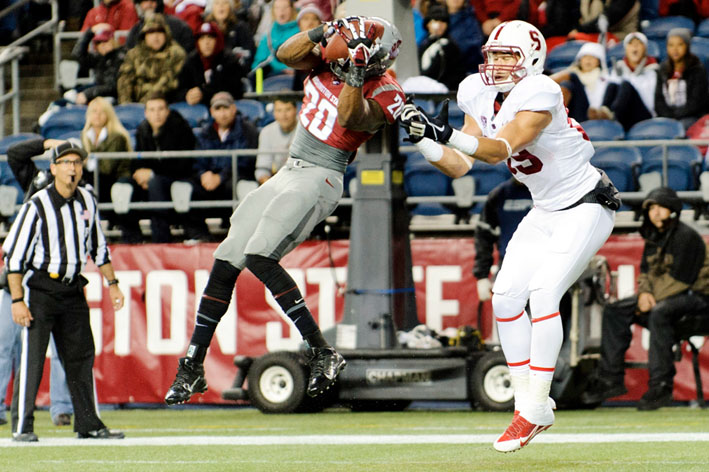
WASHINGTON STATE
Red Zone Trips: 3
Red Zone Scores: 2 (2 FGs)
Play Selection: 5 Runs, 3 Passes
Hogan Passing: 1-for-3, INT
Stanford scored offensive touchdowns from 57, 33, 45, 53 and 22 yards against the Cougars, which more than made up for the Cardinal's red zone inefficiency. The ugly blemish: Hogan forced a second down throw to Cajuste that was picked off by Deone Bucannon.
UTAH
Red Zone Trips: 3
Red Zone Scores: 2 (2 TDs)
Play Selection: 4 Runs, 5 Passes
Hogan Passing: 1-for-5, TD
Trailing 27-21 in the final minute, Hogan threw incomplete on 3rd-and-2 at the Utah 6. Following a Stanford timeout, he threw incomplete again to cement an awful loss. The Cardinal needed a touchdown because a first quarter drive that stalled at the Utah 21 ended with a 38-yard missed field goal by Jordan Williamson.
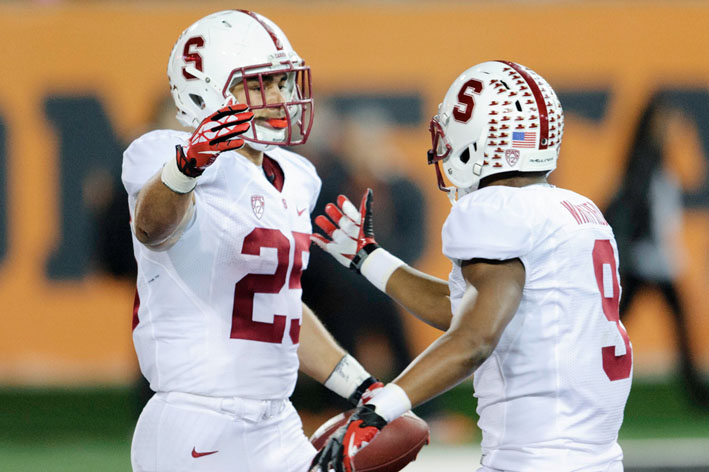
OREGON STATE
Red Zone Trips: 3
Red Zone Scores: 2 (2 TDs)
Play Selection: 4 Runs
Hogan Passing: 0-for-0
Three of Stanford's four plays inside the red zone were runs by Gaffney and two of those resulted in touchdowns. The other play was a run by Dallas Lloyd, which resulted in a lost fumble.
USC
Red Zone Trips: 4
Red Zone Scores: 2 (1 TD, 1 FG)
Play Selection: 5 Runs, 6 Passes
Hogan Passing: 1-for-6, INT
Stanford's most inefficient red zone performance of the season featured a drop by Ty Montgomery, a blocked field goal and, with the score tied at 17 early in the fourth quarter, a Hogan completion to Dion Bailey, who plays for USC.
Here are some more interesting numbers via cfbstats.com and the play-by-play summaries on GoStanford.com.
Stanford's 2013 Red Zone Play Selection
| Home | Road |
| 62 Runs, 20 Passes |
23 Runs, 16 Passes |
Stanford's 2013 Red Zone Passing Splits
| Home | Road |
| 13-for-21, 6 TD, 0 INT |
3-for-16, 1 TD, 2 INT |
One of the completions at home was a 14-yard touchdown pass by Evan Crower in Big Game.
Stanford's 2013 Red Zone Rushing Splits
| Home | Road |
| 62 Carries, 226 Yards (3.64 YPC) |
23 Carries, 75 Yards (3.26 YPC) |
The disparity in red zone production is not as great on the ground.
Stanford's Red Zone Passing Stats by Year (All Games)
| Year | Stats |
| 2013 | 16-for-37, 7 TD, 2 INT |
| 2012 | 28-for-55, 13 TD, 2 INT |
| 2011 | 66-for-91, 27 TD, 0 INT |
| 2010 | 40-for-63, 19 TD, 1 INT |
Andrew Luck was pretty, pretty good. So were Zach Ertz, Coby Fleener and Levine Toilolo.
Stanford's Red Zone Play Selection by Year (All Games)
| Year |
Run-Pass |
| 2013 | 85-36 |
| 2012 | 85-55 |
| 2011 | 107-91 |
| 2010 | 136-63 |
Without the multiple tight end targets Stanford has enjoyed the past few years, the Cardinal is passing a lot less in the red zone this season.
So what about Arizona State?
The good news is that Arizona State's red zone defense isn't especially stingy. The Sun Devils rank 72nd in red zone scoring defense, having allowed opponents to score on 32 of 38 trips. Opposing QBs are 25-for-41 with 11 touchdowns and zero interceptions in the red zone. The Sun Devils have allowed 12 rushing touchdowns and 2.41 yards per carry in the red zone.
Ideally, Hogan bypasses the red zone and finds Cajuste, Montgomery and Michael Rector for multiple long touchdown passes, but chances are he will attempt a pass or two inside the 20. When he does, let's hope he finds a way to imagine he's at Stanford Stadium, where the Cardinal scored on all six of their trips to the red zone against the Sun Devils in September. The Cardinal can't afford to leave points on the field against the best team they've faced on the road all season.